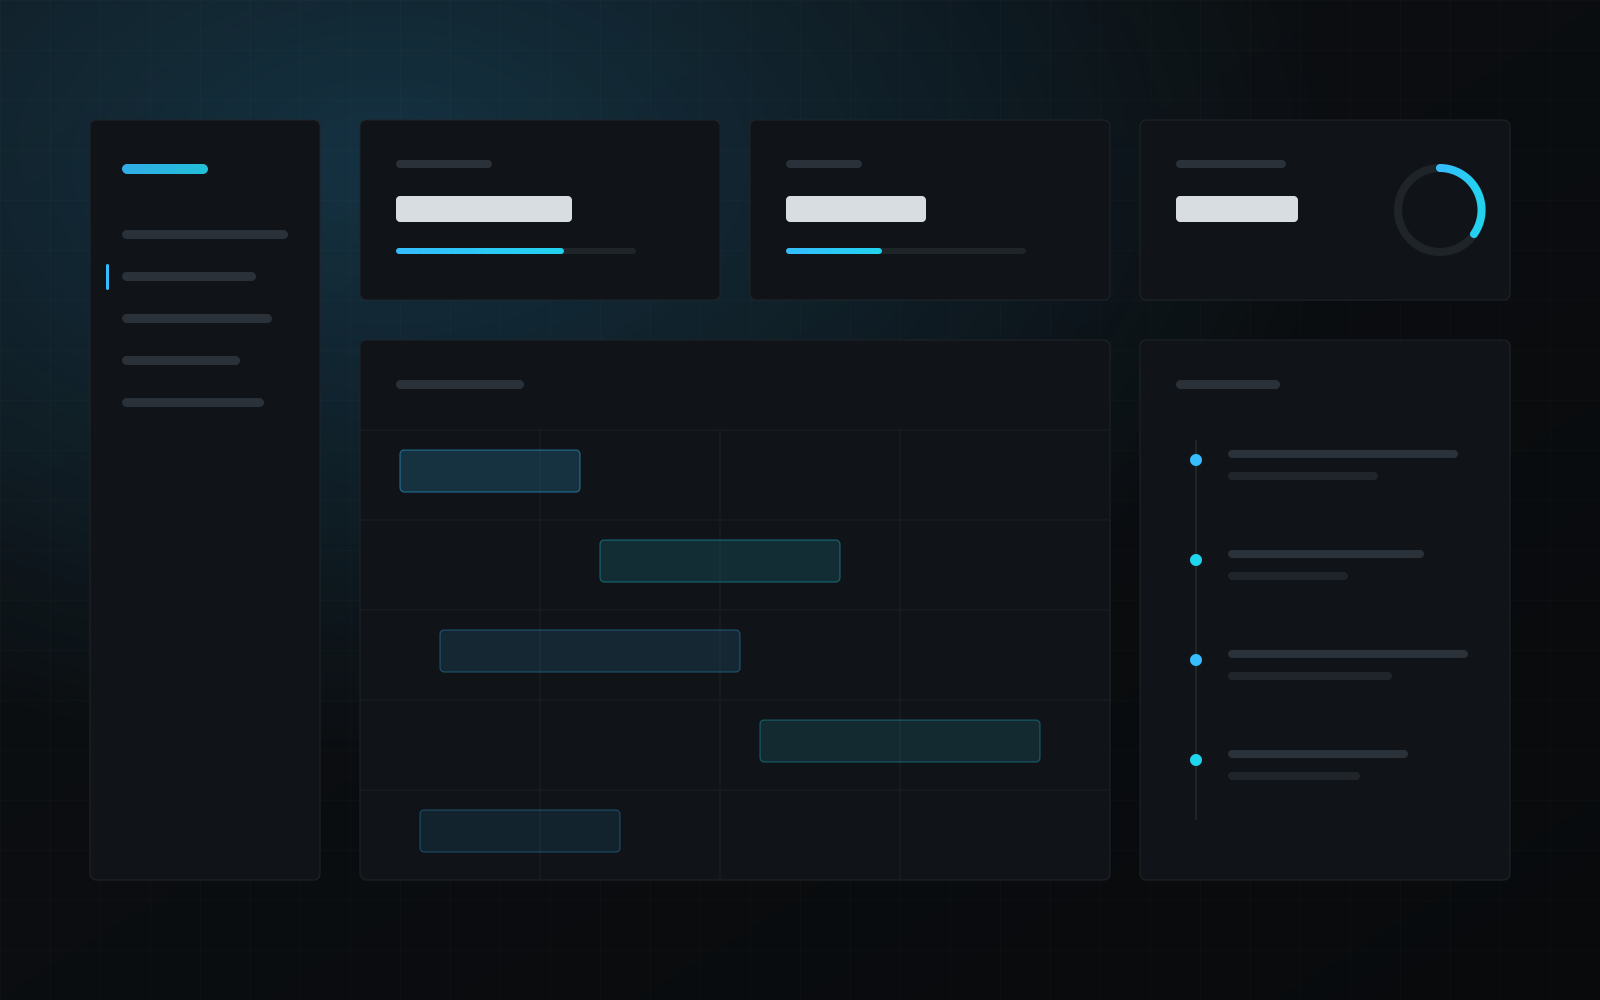
 Custom Software
Custom software solution designed to streamline business operations across scheduling, resourcing and reporting.
- Next.js
- TypeScript
- PostgreSQL
- REST API
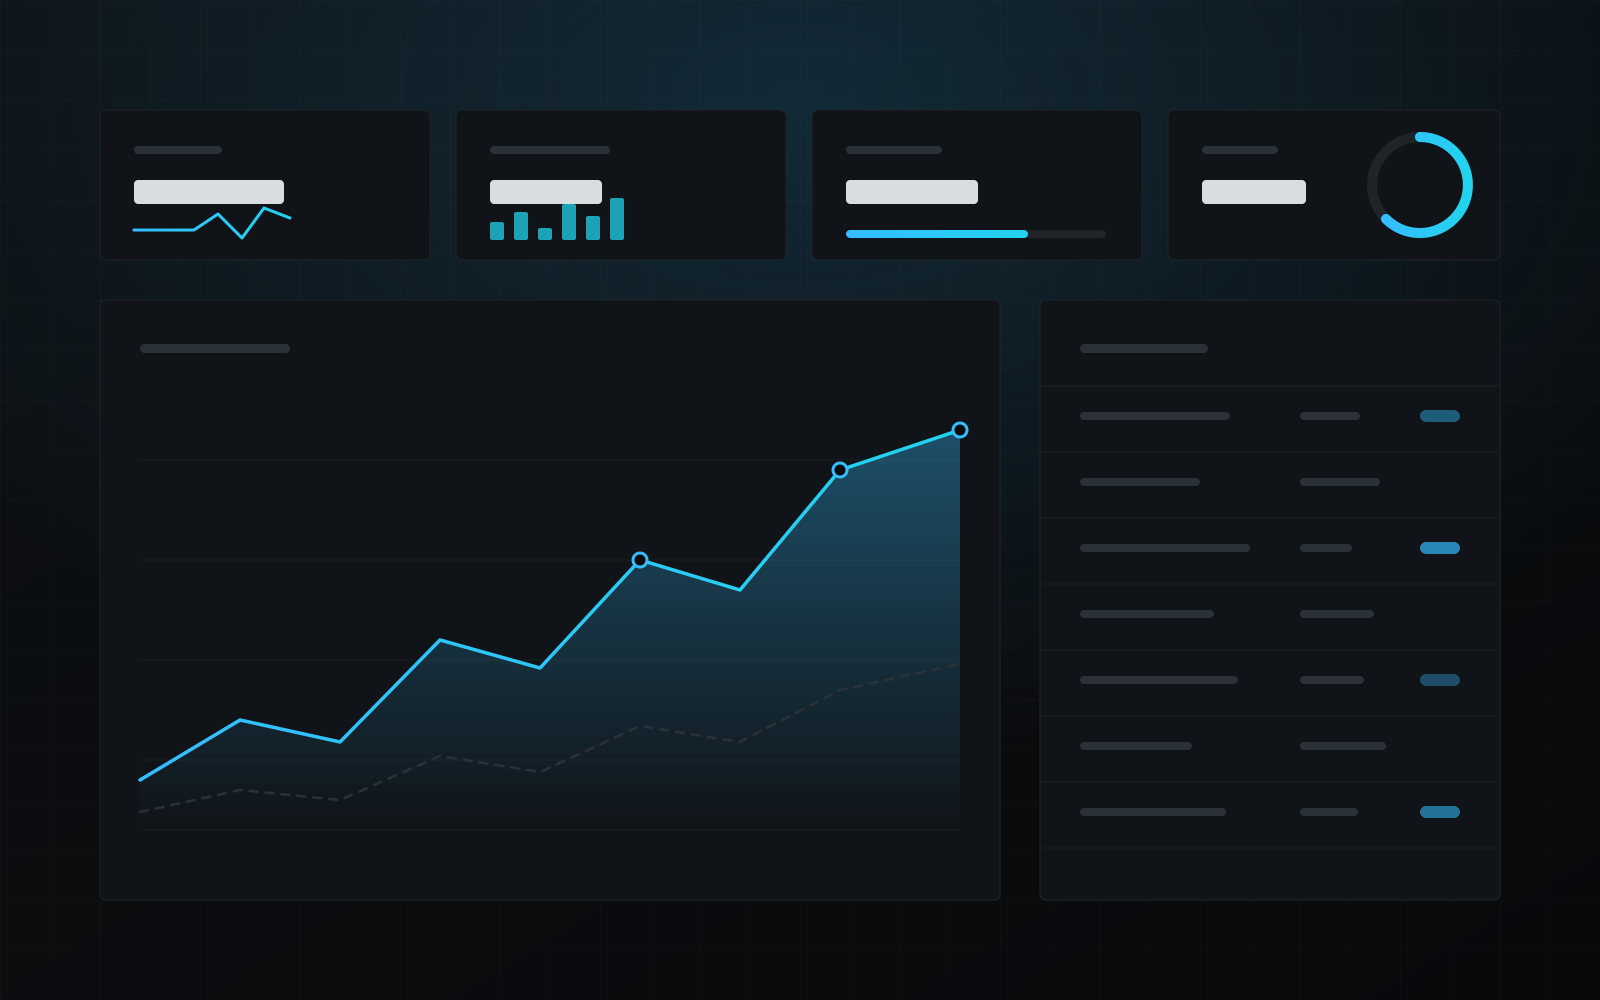
Data & Analytics
A reporting layer that pulls from operational systems on a schedule and presents a consistent, trusted set of business metrics.
Three source systems produced three different answers to the same question. Leadership had lost confidence in reporting, and analysts spent most of the week rebuilding the same figures by hand.
Defined metric ownership and definitions before building any visualisation.
Built scheduled extraction and transformation pipelines with validation at each stage.
Designed dashboards around decisions, not around available chart types.
Added anomaly alerting so data quality issues surface before the report does.
Outcome
Custom SoftwareCustom software solution designed to streamline business operations across scheduling, resourcing and reporting.
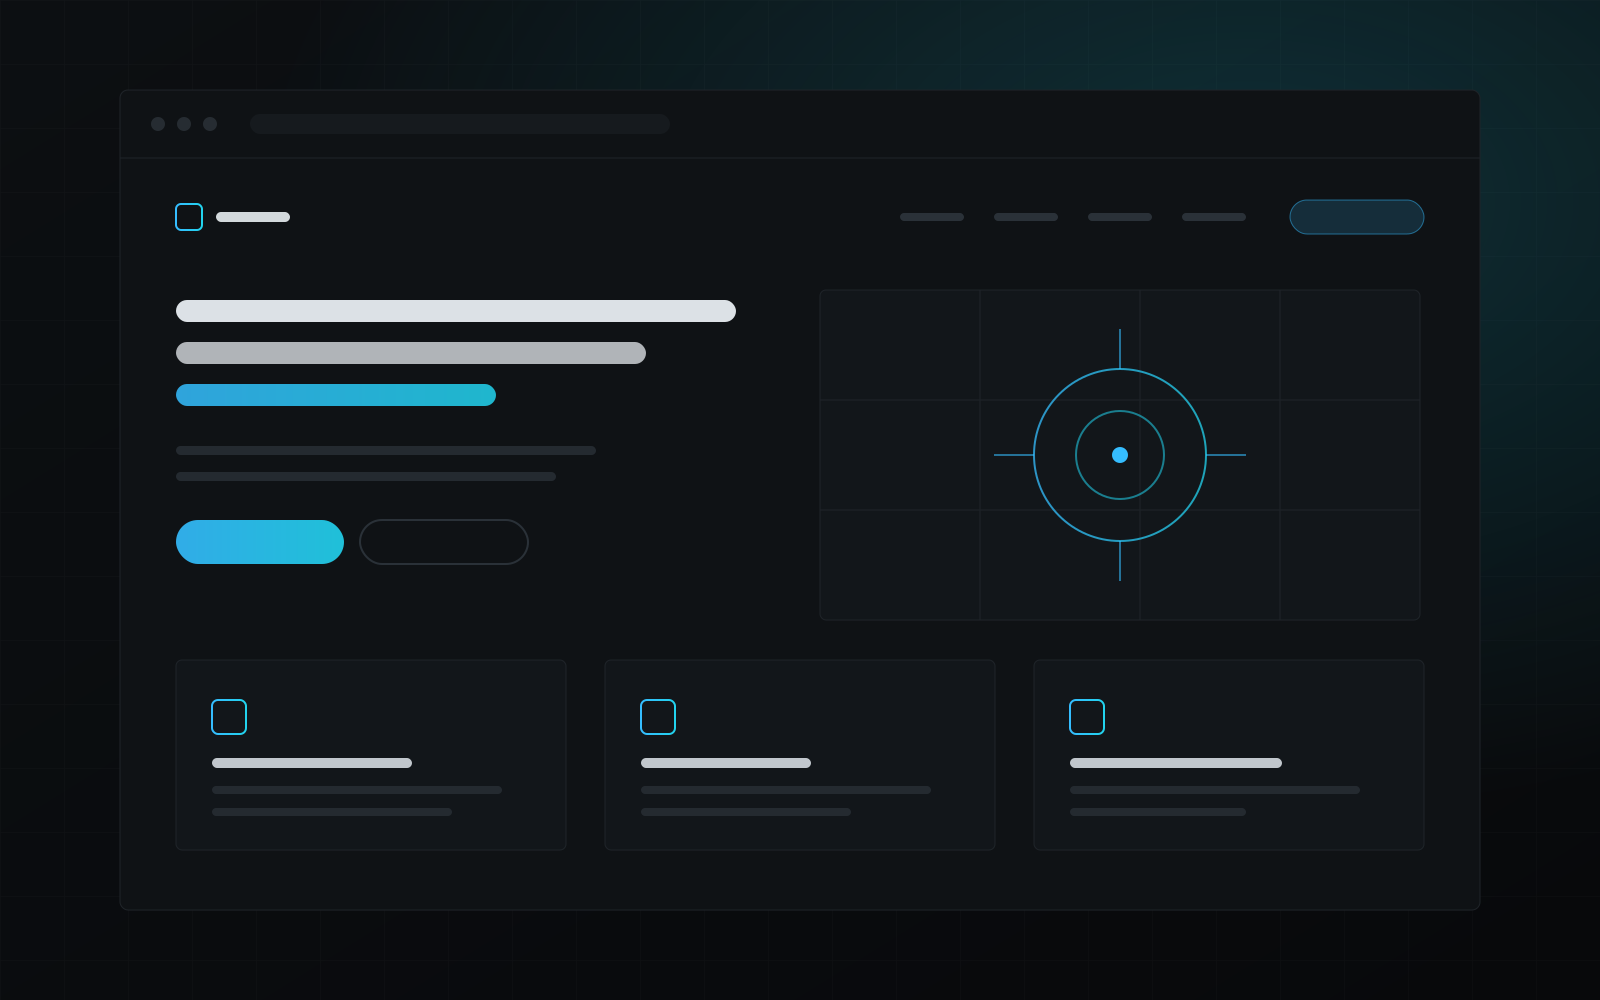 Web Development
Modern corporate website designed for a professional organization, engineered for speed and search visibility.
Tell us where the work is getting stuck and we will show you what a solution would involve.